As of late, it seems that the U.S. and China trade war is the center of investors’ attention. We argue, however, that investors should instead focus their attention on the state of the U.S. economy, which we believe to be in the mid to late expansionary stage of the business cycle. Some market indicators, such as the long-term implied growth from the fixed income market may be of concern to some, but the bulk of business cycle indicators still show a positive environment for equities. That said, we believe there is plenty of upside in selected areas of U.S. equity markets.
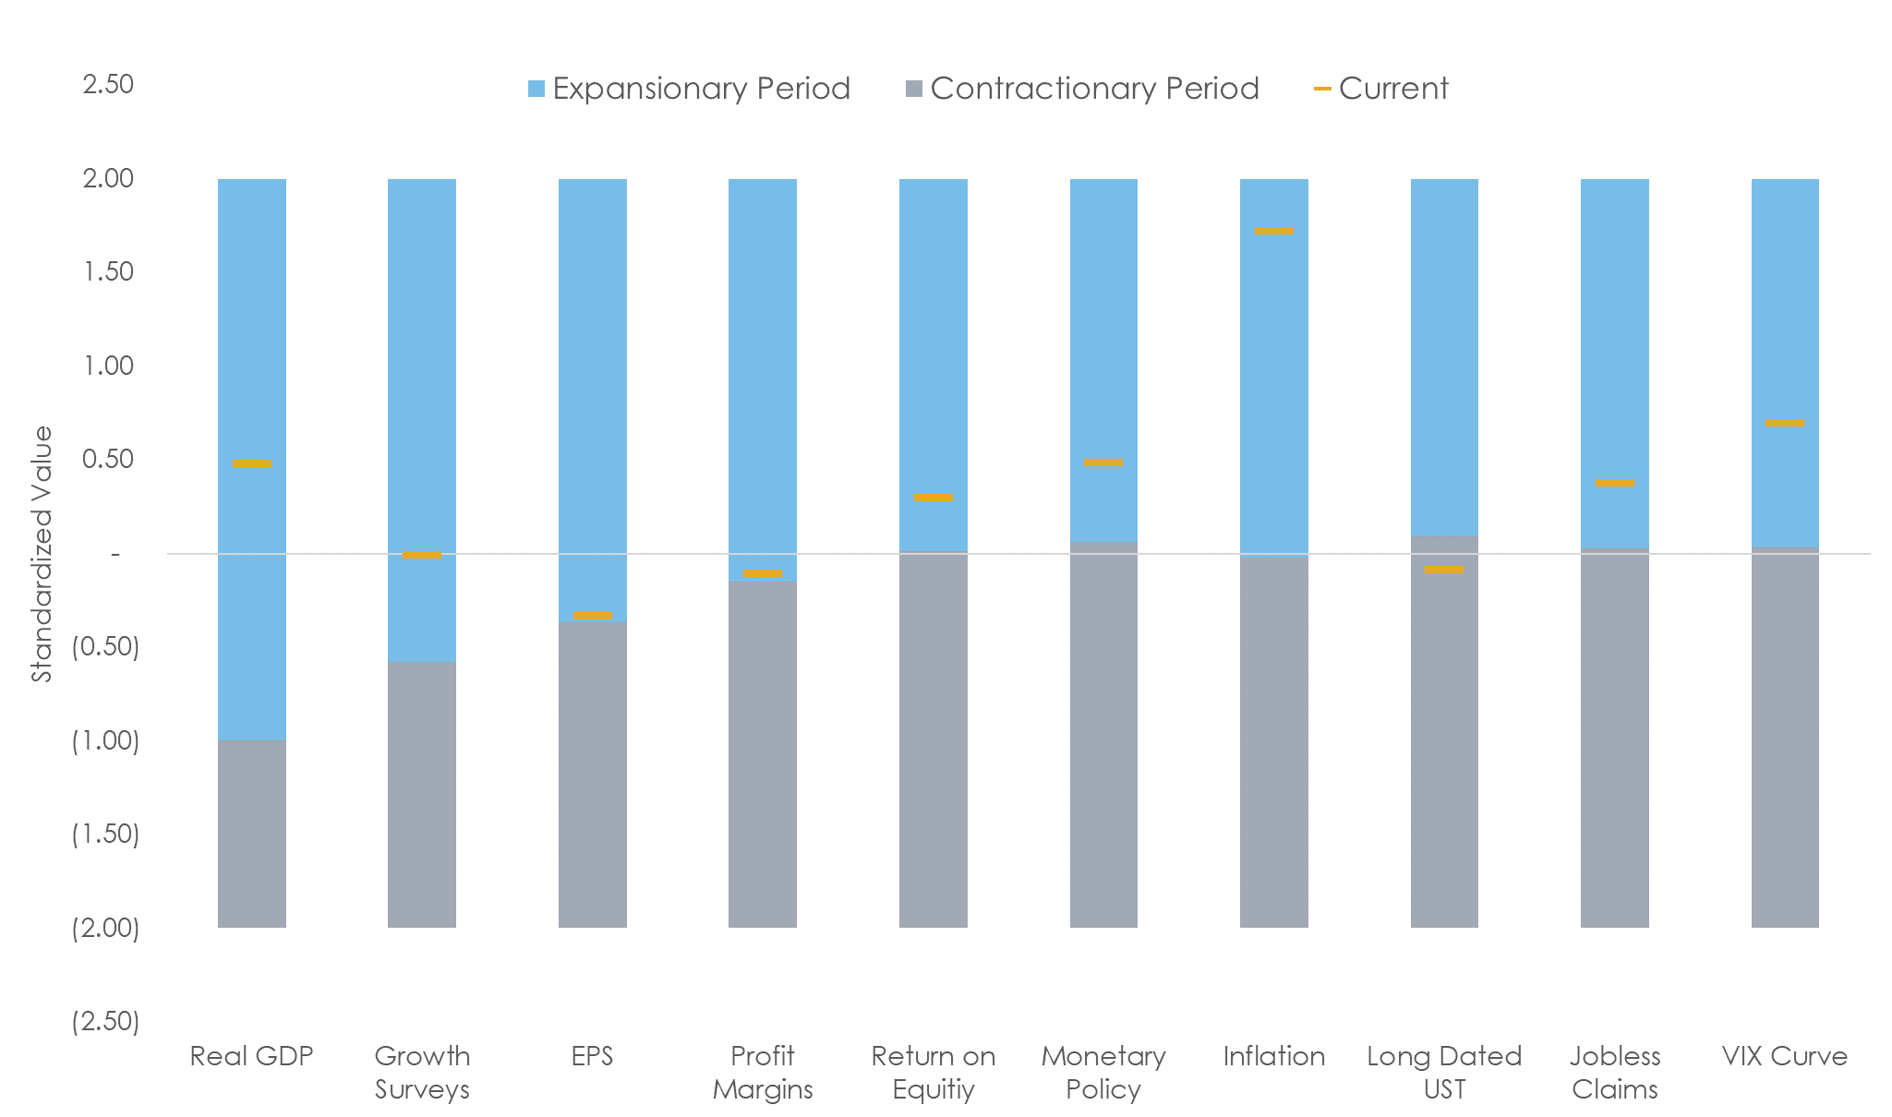
We analyze the business cycle across several corporate and macroeconomic variables, each of which provides a distinct but complementary view of markets. Notably, we look at Real Gross Domestic Product (“ Real GDP”), Growth Surveys, Earnings-per-share (“EPS”), Profit Margins, Return on Equity (“ROE”), LIBOR Rate, Inflation, Long Dated U.S. Treasuries, U.S. jobless claims, and the VIX Curve. For illustrative purposes, each variable is standardized, and color ranges are overimposed to depict expansionary periods (blue) vs contractionary periods (gray) of the business cycle. Our results show that the vast majority of these variables are consistent with the view that we still are in the expansionary stage of the business cycle.
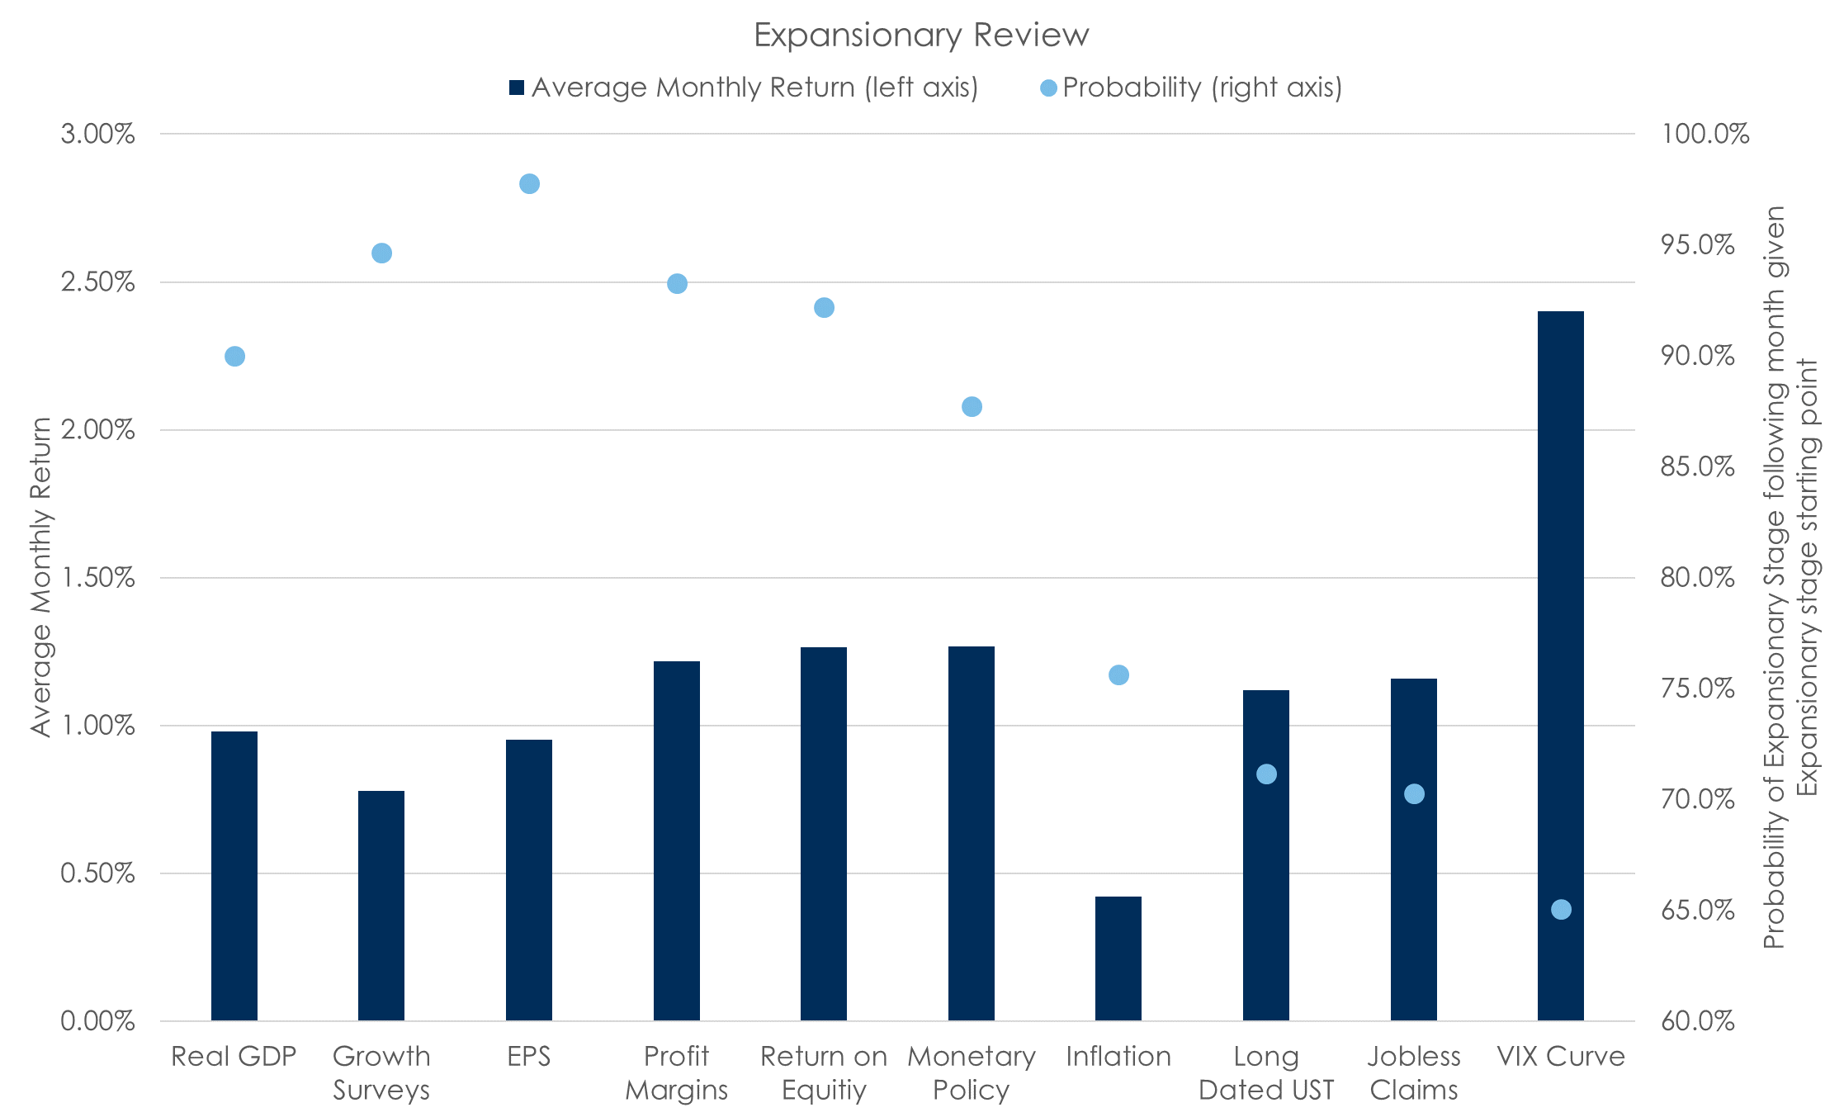
It is important to understand that the transition from an expansionary to a contractionary stage of the business cycle occurs gradually. Figure 2 below plots the probability of a month being expansionary given the prior month being expansionary. This conditional probability ranges from 65% to 98%. In other words, the current month is a reasonable proxy for the state of the business cycle in the next month. Additionally, figure 2 plots the average monthly performance, over the last twenty years, for the S&P 500 during the expansionary months for each variable. In summary, we expect equities to continue delivering attractive returns in selected areas of the market. Based on our analysis, we would not expect this to change abruptly, and certainly, before corporate and macroeconomic variables begin to deteriorate.
The Innealta Dynamic portfolios utilize our proprietary three-lenses approach (i.e., fundamental, macroeconomic, and behavioral) to evaluate the risk-reward potential across different asset classes, regions, and sectors. We believe that data-driven decisions have the potential to improve investment decision-making and ultimately outcomes. For more information about our market views, commentaries, and investment solutions, please contact us at consulting@innealtacapital.com
Figure 1: Innealta Capital. As of 04/30/2019. Time frame 04/30/1999 to 04/30/2019. Frequency monthly. All values and ranges were standardized using a z-score approach and measured using twenty years of data except the “VIX Curve,” which uses ten years of data. “Real GDP” refers to the quarterly change in real U.S. gross domestic product. “Growth Surveys” refers to the ISM Purchasing Managers Index. “EPS” refers to the six-month changes in the trailing twelve-month earnings-per-share. “Profit Margin” refers to the three-month change in the trailing twelve months profit margin of the S&P 500. “Return on Equity” refers to the three-month change in the trailing twelve months return on equity of the S&P 500. “Monetary Policy” refers to the three-month change in the three month U.S. LIBOR rate. “Inflation changes” refers to the three-month change in the U.S. Personal Consumption Expenditure Core Price Index YoY. “Long Dated UST” refers to the three-month change in the yield of the on-the-run 30 year U.S. Treasury. “Jobless Claims” refers to the three-month change in the U.S. initial jobless claims as of the last week within the month. “Equity Curve Volatility” refers to the three-month change in the ratio of the front month CBOE VIX futures contract to the third month CBOE VIX futures contract.
Figure 2: Innealta Capital. As of 04/30/2019. Time frame 04/30/1999 to 04/30/2019. Frequency monthly. Average monthly return and conditionally probabilities measured using twenty years of data with the exception of the “Equity Volatility Curve,” which uses ten years of data. Average monthly returns calculated using the S&P 500 Total Return Index. “Real GDP” refers to the quarterly change in real U.S. gross domestic product. “Growth Surveys” refers to the ISM Purchasing Managers Index. “EPS” refers to the six-month changes in the trailing twelve-month earnings-per-share. “Profit Margin” refers to the three-month change in the trailing twelve months profit margin of the S&P 500. “Return on Equity” refers to the three-month change in the trailing twelve months return on equity of the S&P 500. “Monetary Policy” refers to the three-month change in the three month U.S. LIBOR rate. “Inflation changes” refers to the three-month change in the U.S. Personal Consumption Expenditure Core Price Index YoY. “Long Dated UST” refers to the three-month change in the yield of the on-the-run 30 year U.S. Treasury. “Jobless Claims” refers to the three-month change in the U.S. initial jobless claims as of the last week within the month. “Equity Curve Volatility” refers to the three-month change in the ratio of the front month CBOE VIX futures contract to the third month CBOE VIX futures contract.
The S&P 500 Index is an American broad market index based on the market capitalizations of 500 large companies having common stock listed on the NYSE or NASDAQ.
This material is for informational purposes and is intended to be used for educational and illustrative purposes only. It is not designed to cover every aspect of the relevant markets and is not intended to be used as a general guide to investing or as a source of any specific investment recommendation. It is not intended as an offer or solicitation for the purchase or sale of any financial instrument, investment product, or service. This material does not constitute investment advice, nor is it a substitute for such professional advice or services, nor should it be used as a basis for any decision or action that may affect your business. Before making any decision or taking any action that may affect your business, you should consult a qualified professional adviser. In preparing this material, we have relied upon data supplied to us by third parties. The information has been compiled from sources believed to be reliable, but no representation or warranty, express or implied, is made by Innealta Capital, LLC as to its accuracy, completeness or correctness. Innealta Capital, LLC does not guarantee that the information supplied is accurate, complete, or timely, or make any warranties with regard to the results obtained from its use. Innealta Capital, LLC has no obligations to update any such information.
Flag of the United States of America with a large display of daily stock market price and quotations during normal economic period image by WilliamPotter/Shutterstock.com
220-INN-05/22/2019